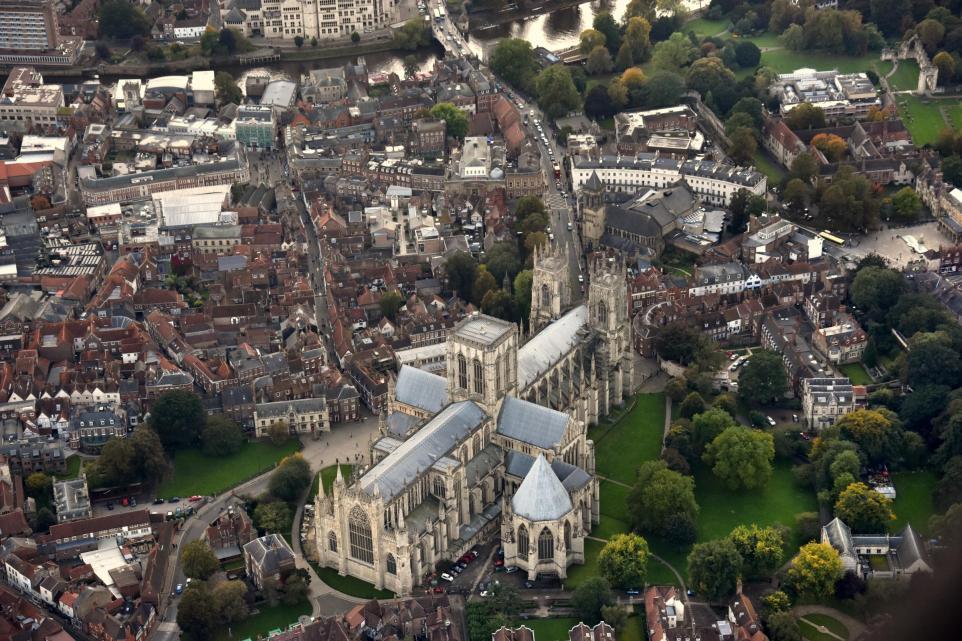
York is outperforming nearly all other cities economically, with living standards rising faster than most parts of the UK.
However, the city’s relative good fortune under a Conservative government contrasts with the vast bulk of the country where people are much worse off than if growth had continued as it did under Labour's Tony Blair and Gordon Brown.
Research from the Centre for Cities has revealed that nationally, people today have £10,200 less spending money on average than they would have had if pre-2010 disposable income trends had continued in the UK.
People are out of pocket in 56 of the UK's 63 largest towns and cities, compared to 1998-2010 growth rates, when Labour was last in power.
READ MORE:
But “almost all places” are better off than they were in 2010, says the independent think tank, which aims to improve life in our cities and is supported by leading Labour mayors such as Tracy Brabin for West Yorkshire, Susan Hinchcliffe of Bradford and Greater Manchester’s Andy Burnham.
The organisation found residents of once oil-rich city Aberdeen have suffered most on average, with disposable income down by £45,240 on where it would have been, though at £746pw (per week), its average wages outperform the national average of £666pw. Derby performed best (up £2,110) for rising disposable income.
York’s average wages of £637pw, placed it 27th out of 63 nationally, but among the highest in the north.

When it came to rising disposable income, York was fifth best out of 63 as this increased £900 above trend and up £2,175 since 2010. The increase of 0.9 per cent a year since 2010 compares with 0.8 per cent a year before it from 1998-2010, maintaining York’s position among the UK’s most prosperous cities. The national average increase was up £3,300, fuelled by London’s £4,325 increase.
The Centre for Cities says the national shortfall in disposable income compared to previous growth rates is a result of a jobs boom in the UK since 2010, which has not been accompanied by growth in productivity - a key driver of higher wages.
And for those places like York, which did better in more recent years than the period before, the centre says this was not because of strong growth post-2010, but because pre-2010 “performance was underwhelming".
While all but two places saw the number of jobs available grow, productivity growth lagged pre-2010 performance in all but five cities.
York saw employment growth of seven per cent since 2010, just below the national average of eight per cent. It had 7,000 more jobs in 2022 than in 2010. In addition, productivity was poor, with real output per hour dropping 0.8 per cent in York, compared with the national average increase of 1.5 per cent over the period, suggesting many roles were created in lower productivity activities.
However, York scored highly for having the UK’s third-highest employment rate, with 82.8 per cent of people of working age in employment, compared with 75.5 per cent nationally, and it having the lowest claimant count rate of 1.7 per cent claiming work-related benefits, compared with 3.7 per cent nationally.
The city is well-educated, with it being the fifth best for those with ‘higher level’ qualifications at 60.3 per cent (45.5 per cent nationally).
When it came to Gross Value Output per hour, at £32.1 per hour, York was midway in the table, but below the UK average of £36.30, but above many cities in the Midlands and the North.
The Centre for Cities said higher housing costs ate into disposable income. It found found that housing became less affordable in almost every place in the 2010s, with the steepest rises in the South East such as Cambridge, London and Brighton.
The report notes average house prices in York of £345,700, compared with a UK average of £328,600, with the city in 2022-23 experiencing the third highest house price growth in the country of 3.4 per cent. It made the city 11th worst for housing affordability with the average house costing 10.5 times the average salary, compared with nine-times the average salary nationally.
York’s housing stock grew slowly, up just 0.4 per cent during 2021-22, compared to a national average of 0.9 per cent. It increased by 490 from 91,050 to 90,640 that year. York was also one of the UK’s slowest growing cities, coming in at 55th out of 63, with population growth of 2.7 per cent, from 199,157 to 204,551, since 2010, compared to a total UK population increase of 6.1 per cent from 63,714,974 to 67,622,516.
Altogether, this meant when it came to ‘poverty’ the number of children in ‘absolute’ poverty decreased in York by 2.3 per cent between 2014 and 2014, helped by the growing number of jobs.
However, the number of children living in relative poverty has increased 0.9 per cent, with the figures showing 100 more children in relative poverty in 2021 than in 2014. Reflecting national trends, more children in poverty (up 4.1 per cent in York) are in working households, suggesting low-income households have been hit hardest, the centre also reported.


Comments: Our rules
We want our comments to be a lively and valuable part of our community - a place where readers can debate and engage with the most important local issues. The ability to comment on our stories is a privilege, not a right, however, and that privilege may be withdrawn if it is abused or misused.
Please report any comments that break our rules.
Read the rules hereLast Updated:
Report this comment Cancel